
How does it work?
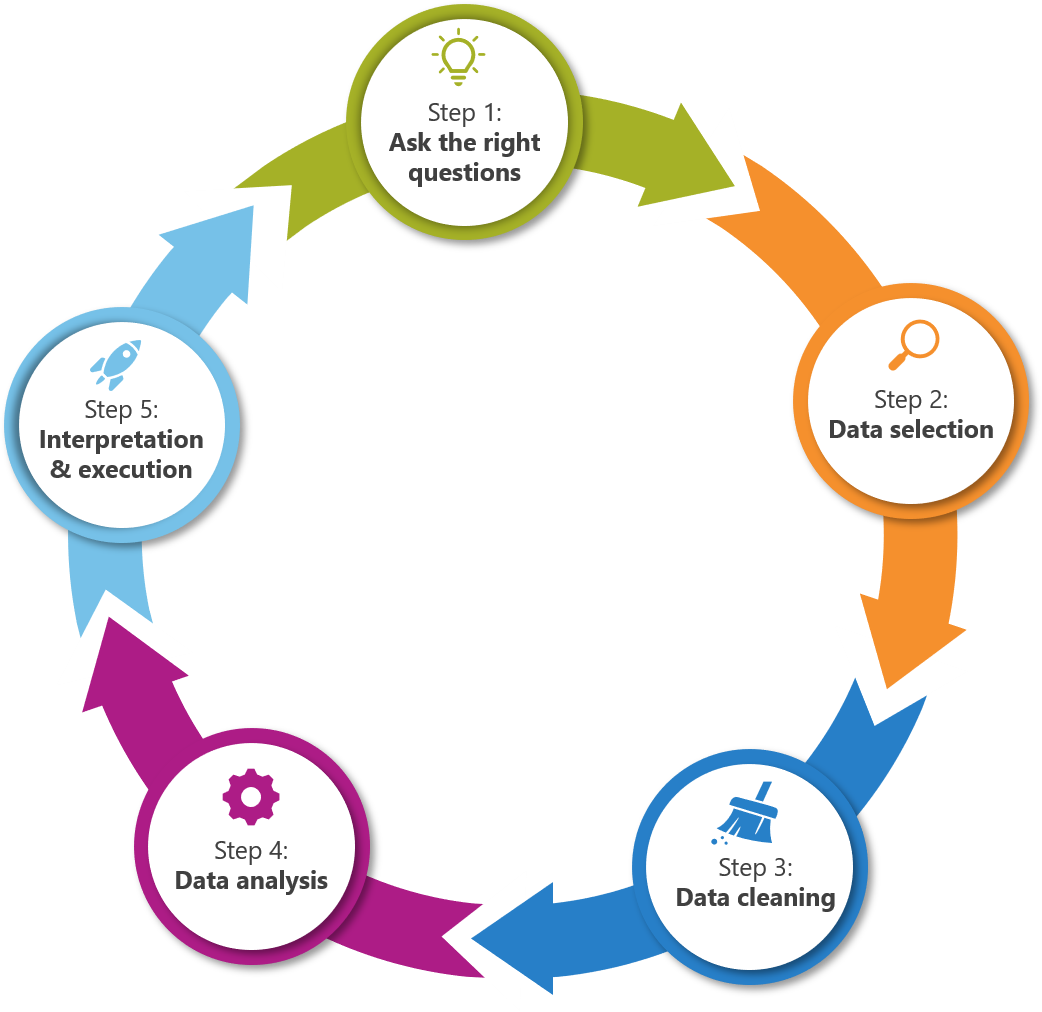
For this type of analysis, we often work according to an iterative process, as shown below.
Step 1: We meet you and ask some questions to get to what exactly the problem is and define what possible influences could be according to your experience.
Step 2: If available, the appropriate data is selected. If not, the necessary steps are first taken to log the additional data. In this case, it is very useful to start logging as much data as possible in order to reduce the number of iterations. The more available data, the less need to look in the future to start logging additional data again.
Step 3: The data is preprocessed and made usable for analysis.
Step 4: Analysis is performed. This involves identifying correlations, creating insightful plots/figures, applying statistical techniques.
Step 5: We discuss and interpret the results with you. Several conclusions may follow from this:
- There is still too little data or a piece of the data is still missing: additional data logging
- Certain things stand out in the “bigger picture”: perform detailed analysis on a component
- Additional insights, new ideas emerged: additional analysis on a new component
- Clear correlations found: take actions to address them in the process
Any actions are taken.
We return to step 1, again asking the appropriate questions: what adjustments/additions need to be made in order to incorporate the
conclusions obtained back into the correlation analysis?
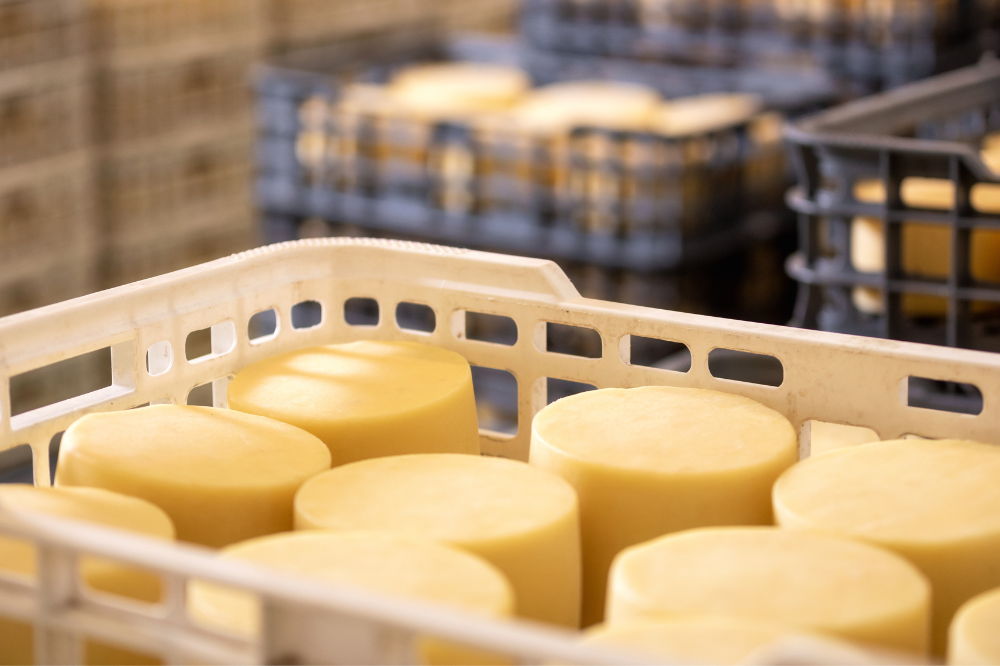
Example cheese weight analysis
Step 1: Different lines produce the same cheese
Step 2: It is agreed what data will be analyzed and what additional data will be logged
Step 3 & 4: Preprocessing and analysis
Step 5: Several things stand out:
- 1 line produces different weights compared to the other lines
- There is a seasonal effect in the data (standardization of the milk can be improved).
- The pasteur used has an influence
Next iteration:
Step 5:
- Line producing the other weights is next to the window and has influences from the weather
- Different settings on both pasteurizers
Where is the difference being made?
This is where we can do full justice to the strength of the data analytics team. Our experience in the manufacturing process together with our expertise in data analytics ensures that the undesirable behavior in your process is figured out in detail.
Working in an iterative process, the work happens in cycles with a meeting with you after each cycle. In this way you can
follow along closely and give input. After each iteration there is also a GO/NO-GO, in which a decision is made whether to investigate further, or whether some adjustments will be made to the process first, after which the impact can be reviewed.
Advantages cause and effect analysis
- Iterative process where you provide input
- Insightful figures provide clear connections in your process
- Data often contains insights that are otherwise difficult to find
- Lower variance in your process and reduce alarms