
How does it work?
Step 1: logging all process data from the control layer, such as production status, flow meters, temperatures, electricity meters….
If you have enough meters throughout all your subprocesses, then you already have the necessary data. If not, a virtual meter can possibly assist you in logging more data.
Step 2: slice and transform
In the data platform, connections are made between different tags and calculations are done to obtain certain aggregate tables. The Slicer and Transformer calculate live the consumption of your machine per status/minute/shift/…
Step 3: visualization in a BI tool
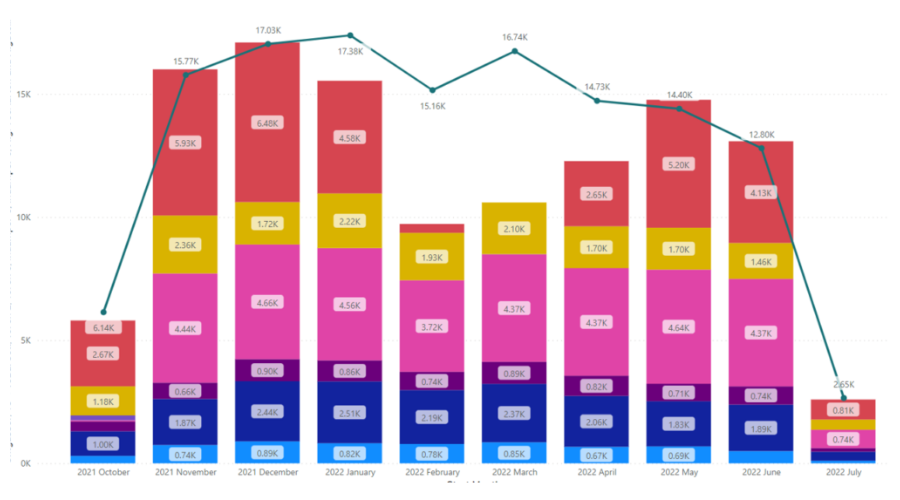
Once the aggregated data is available, it becomes possible to create dashboards. You can see an example in the image above: the consumption of different installations versus your main consumption meter.
This not only gives insight into the size of the consumption of the installations. More so, if there are anomalies in the sum of the consumptions versus the main meter, these are interesting anomalies to investigate further. Otherwise, such anomalies are difficult to pick up at the plant.
Double benefit!
Where is the difference being made?
EMS uses data analytics to support you in preventing unnecessary energy consumption.
In a factory or brewery, it is sometimes difficult to see the different energy flows through the plant. Energy transport is often hidden in pipes and cables running throughout the plant. Knowing which installations are major consumers is not always easy to figure out. Let alone that it is easy to notice if an installation consumes too much during certain steps compared to similar installations.
EMS makes it easy to map the energy consumed throughout your plant. In addition, it also allows for faster reaction to incorrect situations as this tool also draws your attention to outliers and deviations.
Advantages EMS
- Energy consumption is broken down per consumer
- Convenient visualization, clear dashboard
- The prepared data allows you to quickly create your onw insightful dashboards in a BI tool
- Anomaly tool
- Helps you save on energy